
Writing · · 7 min read
Community Mapping vs. Interactive Maps: Which One Does Your Neighborhood Actually Need?
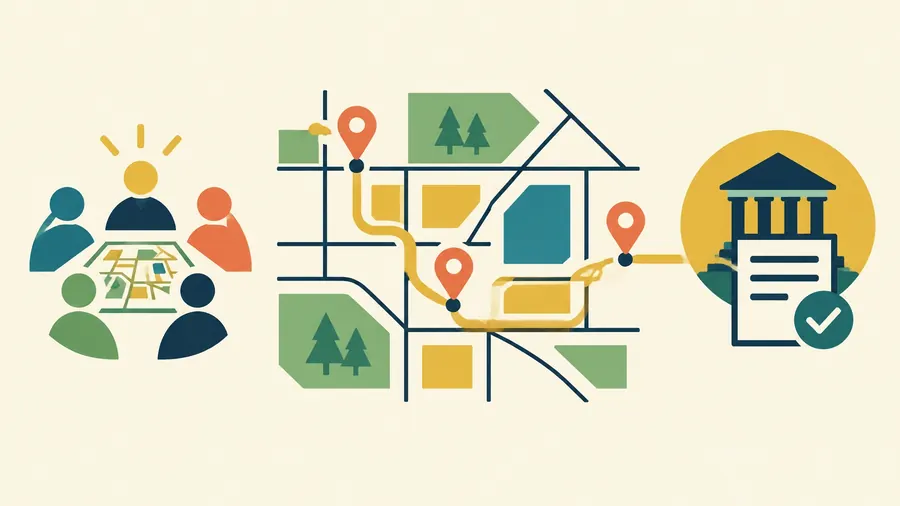
If your neighborhood group is deciding where to focus its next campaign, a map can help. But the first question is not whether the map should be interactive. It is what you need the map to do.
An interactive map lets people explore information: zoom in, switch layers, search locations, or open details. Community mapping is a process for gathering and using local knowledge. Residents help define what matters, document what they see, and interpret the result.
The two can work together. But an interactive map, by itself, does not make a project participatory or turn information into a policy decision.
The difference is in the work around the map
A city department might publish an interactive map of sidewalks with repair dates and condition ratings. It can be useful for finding information. But if residents had no role in deciding what to measure, checking the data, or setting repair priorities, it is not necessarily community mapping.
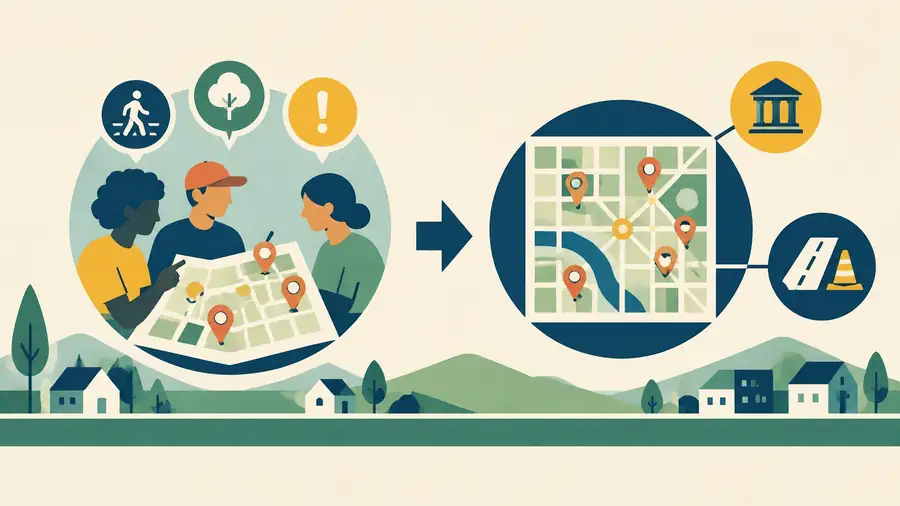
A community mapping project might begin with a different question: Which crossings feel unsafe to people walking to school, and what changes should the city consider? Residents could identify locations on paper maps or during walking audits. A project team could compare those observations with crash records and street data, then take a shared set of priorities to the transportation department.
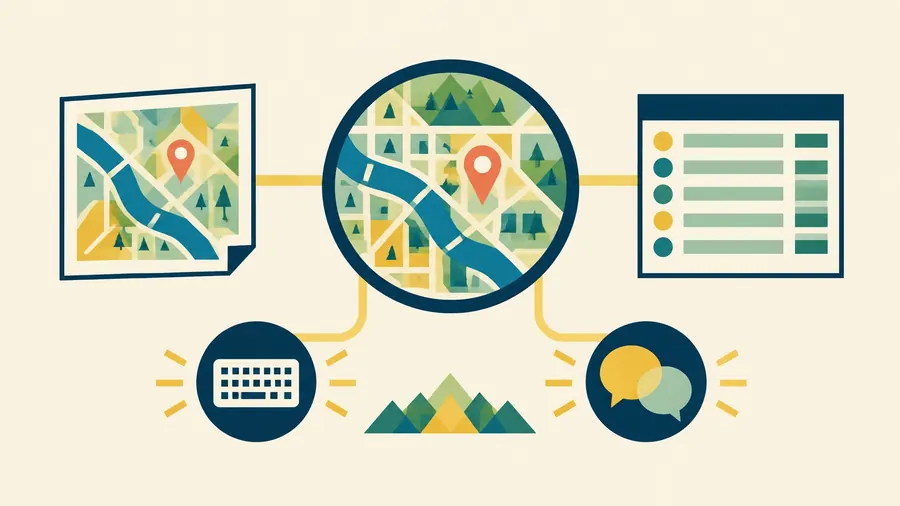
That work may produce an interactive map. It may also produce a printed map, a data table, a short report, or a set of recommended actions. The format is a choice. The community's role in shaping the work is the defining feature.
What can community mapping change?
Community mapping can make local conditions visible when standard datasets miss them. Residents may know where stormwater collects after a heavy rain, which bus stop lacks a safe crossing, or which vacant lot has become an ongoing dumping site. That knowledge can be checked, organized, and compared with other sources.
A study of community mapping in eastern Tijuana describes residents identifying environmental risks and community assets, including trash dumps and contaminated runoff. The collected information helped planners check existing land-use data and identify issues for broader planning. The research also describes limits: the local plan was delayed, and not every community recommendation had moved into a concrete intervention. Mapping helped bring issues into the planning process; it did not guarantee a particular outcome. (Prado, "Border Environmental Justice PPGIS," 2021)
A Brooklyn active-transportation initiative offers another example of how community input can connect to implementation. Residents and local organizations identified streets where safer walking and biking infrastructure was needed. City transportation staff added technical analysis to the community's proposals. Of a proposed 28-mile network, 10 miles were installed in 2013-14. The process also led to smaller street improvements and bicycle racks. (DeGregory et al., "Community Vision and Interagency Alignment," 2016)
Neither example says that every map changes policy. Both show why the work should start with the decision or action you want to inform, not with a request to "make us a map."
When interactive maps are the right tool
Choose an interactive map when the main job is to help people find, compare, or explore information. For example:
- Look up places: Find a park, community service, project site, or local resource.
- Compare conditions: Switch between neighborhood indicators or policy layers.
- Inspect records: Open details about a property, route, or public investment.
- Keep information current: Publish a dataset that will be updated and revisited.
Interactivity should earn its place. If readers only need to see the overall pattern, a clear print map may do the job better. If they need to search by address or compare several layers, an interactive map may be useful.
Plan for access from the beginning. The Minnesota guide to accessible interactive web maps recommends considering whether the information needs to be interactive and making sure the map's content is accessible. In practice, that can mean keyboard-operable controls, clear labels, sufficient contrast, and a text or table alternative. A public-facing map should not make a mouse, a fast connection, or the ability to distinguish colors a requirement for understanding the information.
When community mapping is the right tool
Choose community mapping when the project needs more than a view of existing data. It may be the right approach when you need to:
- Identify a local question. Residents and organizers help decide what should be documented and why.
- Fill gaps in existing information. Local observations can help verify what official records show, or point to what they leave out.
- Set priorities. Participants review what was gathered and decide which findings matter most.
- Connect evidence to an action. The findings are prepared for a planning process, funding request, service change, or public discussion.
- Show what happened next. The project records what decision-makers accepted, changed, or did not act on.
This approach also requires care. Participation is not automatically representative. Be clear about who took part and who may be missing. Decide how contributed information will be checked and updated. Protect sensitive locations when sharing them could put people or places at risk. Explain who owns the data and who can reuse it.
A map needs a handoff
A map can support a decision, but it cannot make one. Before collecting data, identify who has authority over the issue and what process they use. Find out what evidence they need, what deadlines apply, and what they can realistically change.
Then plan the handoff. It might be a meeting with city staff, a submission to a neighborhood plan, a grant application, or a public presentation. Name the source and date for each dataset. Distinguish a measured condition from a resident's observation or interpretation. If the information changes over time, decide who will maintain it.
Without that next step, a community mapping project can produce a useful record without influencing the policy, budget, or service it was meant to address. The Tijuana study is a reminder to be specific about what changed and what remains unresolved.
How the work can fit together
At TresPies, we approach mapping as research and design work, not just a choice of software. That can include neighborhood maps, equity data infrastructure, equity atlases, and interactive and print maps.
For example, Madison Equity Data brings together neighborhood-level information in an English- and Spanish-language data commons. The TresPies site describes its atlas as covering Dane County's 125 census tracts, with sources cited and estimates rated for confidence. It is an example of research and data infrastructure paired with an interactive presentation, not a claim that any one map alone changed a policy decision.

For another use case, TresPies has created six interactive and print-ready maps for a community-development organization's portfolio of 225 properties, with records connected to their sources. A print map can work in a meeting or report; an interactive map can support exploration. Which one leads depends on the audience and the task.
The project can also begin without a digital map. Paper maps, facilitated sessions, and field observations can help a group determine what information is needed before anyone builds an interface. If the result should become a public data resource, then an interactive map may be a useful next step.
So, which one does your neighborhood need?
If people need to explore information that is already defined, start with an interactive map, or consider whether a simpler format will serve them better.
If the question, evidence, or priorities need to be shaped with residents, start with community mapping. Decide how the findings will reach the people responsible for the next step. Then choose the format that makes the work understandable and usable.
Often, the practical answer is both: participatory community mapping to gather and interpret local knowledge, followed by an accessible interactive map, a print map, or both to share the results. The process gives the map its purpose. The map helps carry the process forward.
If you are planning a neighborhood map, equity atlas, or public data project, talk with TresPies. Bring the question you are trying to answer, who needs to be involved, and what decision the work should inform. We'll talk through the research, data, and map formats that fit.